- Open the Tobu app and go to the logbook tab.
- Your skydive entries are sorted by date, starting with the most recent one. You can see the date, jump number, jump type, and dropzone.
- Select the jump you want to review for more detailed information, like exit altitude, freefall duration, and gear used.
- On the map, you can see the jump run in grey, the freefall trajectory in orange, and the canopy trajectory in green. This information helps you understand your performance during movement jumps, analyse your landing pattern, and even understand long-spot recovery.
- The following section shows more detailed information about your skydive, like deployment altitude and distance.
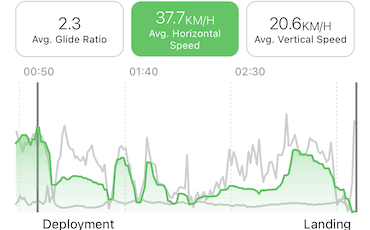
- The performance section shows minimum, average, and maximum vertical speed for non-movement jumps like belly and freefly. For movement jumps, like angles and wingsuit jumps, and canopy rides, you see more relevant information like distance travelled, glide ratio, and average speed.
- To visualise crucial data for every second of your skydive, tap on Show More to access your jump's performance analysis. For both freefall and canopy ride, you can choose between glide ratio, horizontal speed, and vertical speed. Just drag your finger across the graphs to see a second-by-second breakdown of your entire skydive.
Tobu makes it possible to capture detailed data without the need for specialised equipment.